Announcement

Collapse
No announcement yet.

Today`s Low or Close in weekly chart

Collapse
X
 
  • Filter
  • Time
  • Show
Clear All
new posts

  • Today`s Low or Close in weekly chart

    Hi,
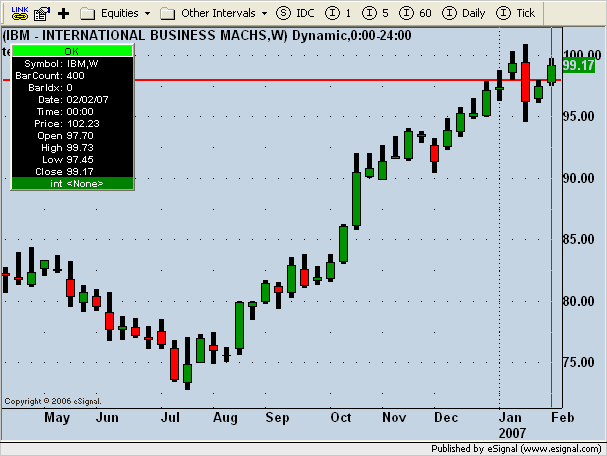
    i want to draw the intraday "today`s low" in the weekly(interval) chart.
    Intraday no problem with the OHCL-formular today`s low.efs.
    But nothing happens, if i put it in the weekly chart. What`s the problem?
    Thanks.

  • #2
    Hello Bügeleisen,

    The formula is for intraday intervals only. The first condition inside main() exits the formula is the chart interval is daily, weekly, or monthly.

    PHP Code:
        if(isMonthly() || isWeekly() || isDaily())
        return; 

    When you are on a weekly chart, there can only be one data point plotted per bar. There are up to 5 intraday daily lows for each weekly bar. What exactly do you want to appear on the chart for each weekly bar? Please explain in greater detail.
    Jason K.
    Project Manager
    eSignal - an Interactive Data company

    EFS KnowledgeBase
    JavaScript for EFS Video Series
    EFS Beginner Tutorial Series
    EFS Glossary
    Custom EFS Development Policy

    New User Orientation

    Comment


    • #3
      I want to draw a line of the current intraday low or the last(close) quote, to compare the line with important support or resistance levels in the weekly chart of the last year.
      How to change the formular?

      Comment


      • #4
        It`s possible to draw the last quote on the right side of the weekly/daily chart in the scale.Isn`t it also possible to draw a horizontal line at this level?
        thanks

        Comment


        • #5
          Hello Bügeleisen,

          The daily and weekly charts can display the last (or current price) on the y-axis. Right-click on the y-axis and select the chart symbol.


          You should then see this price highlighted on the y-axis.


          To draw a line on the chart at the current days low, try the following.

          PHP Code:
          function main() { 

              if (
          getCurrentBarIndex() == 0) {
                  
          addBand(low(0inv("D")), PS_SOLID2Color.red"low");
              }
              
              return;
              

          By specifying the daily interval with inv(), the value will reflect the current day's daily low on bar 0 of the weekly chart.

          Jason K.
          Project Manager
          eSignal - an Interactive Data company

          EFS KnowledgeBase
          JavaScript for EFS Video Series
          EFS Beginner Tutorial Series
          EFS Glossary
          Custom EFS Development Policy

          New User Orientation

          Comment


          • #6
            Hi, i have created a new efs with your formular. I think, i have forgotten something?

            Code:

            function main() {

            if (getCurrentBarIndex() == 0) {
            addBand(low(0, inv("D")), PS_SOLID, 2, Color.red, "low");
            }

            return;

            }

            Comment


            • #7
              Bugeleisen
              If you want to plot this in the price window you will need to add a preMain function in which you have a setPriceStudy(true) statement eg
              PHP Code:
              function preMain(){
                  
              setPriceStudy(true);

              For a complete example use the study you referred to at the beginning of this thread ie Todays Low.efs
              Alex

              Comment

              Working...
              X